


Long Bay Hypoxia Monitoring Consortium

Menu
About UsProgram OverviewCurrent DataHistorical DataRelated Real-time DataWhat do the data mean?Related Real-time DataPublicationsReportsContact Us |
Access current data at the following link, https://www.coastal.edu/pierdata/.
|
About Us
Long Bay Hypoxia Monitoring Consortium
The Long Bay Hypoxia Monitoring Consortium is supporting water quality and biological monitoring at three fishing piers on the Grand Strand. The consortium was established by a resolution of the Coastal Alliance signed in August 2011. The Coastal Alliance is comprised of the mayors from the coastal municipalities of the Grand Strand, including the cities of Myrtle Beach and North Myrtle Beach, the towns of Surfside Beach and Atlantic Beach, and the unincorporated areas of Horry County.
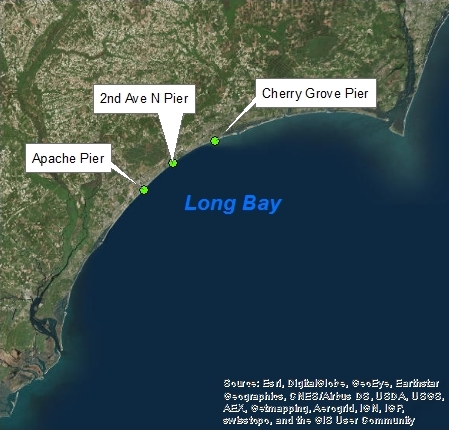
Funding for the monitoring at the Apache Family Campground and Pier, the Second Avenue Pier and the Cherry Grove Pier is being provided by the cities of Myrtle Beach, North Myrtle Beach, and Horry County. The pier owners and operators are providing essential support services.
Coastal Carolina University’s Environmental Quality Lab, under the aegis of the Burroughs & Chapin Center for Marine and Wetland Studies, is responsible for equipment installation, maintenance, and data management. This was the group who made the initial discovery of low dissolved oxygen levels in July 2004, while performing unrelated field work at Springmaid Pier.
The National Oceanic and Atmospheric Administration maintains a federally funded weather and tide station at Springmaid Pier.
History of Funding for Continuous Oxygen Observations in Long Bay
The discovery of low oxygen levels in Long Bay represents a significant concern. In response, several state agencies collaboratively supported the initiation of a continuous water quality monitoring program in Long Bay. This filled a critical information gap, as no dissolved oxygen data were being collected in Long Bay. Therefore the scope and scale of the low dissolved oxygen conditions were unknown, as were its causes and impacts.
The first continuous measurements of dissolved oxygen were collected in 2006 at the Apache and Springmaid fishing piers. Purchase of the monitoring equipment and support for its maintenance was funded by short-term grants acquired by the SC Department of Natural Resources (SC DNR), the SC Department of Health and Environmental Control-Office of Ocean and Coastal Resource Management (SC DHEC OCRM) and the Southeast Coastal Ocean Observing Regional Association (SECOORA). Coastal Carolina University’s Environmental Quality Lab assumed the responsibility for maintaining the equipment and data management. SC DNR’s funding sources included a grant through its Cooperative Fisheries program and water recreation funds approved by the Horry County Legislative Delegation. See Long Bay Near-Shore Water Quality Management for a summary of these early efforts.
Although monitoring at the Springmaid Pier ended in 2007 due to lack of continued funding, observations were continued and enhanced at Apache Pier with support from the SC DNR, SC DHEC OCRM, the SC Sea Grant Consortium and the SC Chapter of the Coastal Conservation Association.
In recognition of a likely linkage between low oxygen conditions and terrestrial inputs of oxygen-demanding substances, the municipalities of the Grand Strand agreed to form a monitoring consortium in August 2011. The mission of the Long Bay Hypoxia Monitoring Consortium is two-fold: (1) to collaboratively support water quality monitoring that will determine the causes and effects of low oxygen and (2) to identify and implement management activities that will mitigate undesirable impacts. Continued monitoring will be performed to evaluate the effectiveness of these management interventions.
Associated Research into the Causes of Low Oxygen in Long Bay
SC DHEC OCRM and the SC Sea Grant Consortium have provided funding to support research into the causes of low oxygen in Long Bay. Some of this research is summarized at: http://www.coastal.edu/wwa/ocean.html. The continuous data measured at the piers are needed to conduct these research efforts. Local funding support for continuous monitoring has been essential in obtaining grant funding as it proves local municipalities are committed to preserving and enhancing water quality in Long Bay.
A two-year project was funded by NOAA from 2011 to 2013 to investigate the role of tidal creeks, called swashes, in transforming and exporting land-based sources of nutrients and organic matter into Long Bay. This work was performed by the Winyah Bay-North Inlet National Estuarine Research Reserve System and Coastal Carolina University. A more detailed description of this project is available at: The Swash Cycle.
Program Overview
Why are Ocean Oxygen Levels a Concern?
Animals use O2 gas to support essential body functions collectively known as aerobic respiration. Oxygen gas (O2) dissolves in all natural waters, such as seawater. Marine animals are adapted to extract this dissolved gas from seawater. For example, fish extract O2 gas using their gills.
When O2 is not present in sufficient amounts, animals die. Fish kills are common when oxygen levels are low. Crabs, shrimp, worms, sea urchins, mussels and oysters have a greater tolerance of low dissolved oxygen, but will eventually be affected if levels remain sufficiently low for long enough periods. Non-lethal impacts include stress and impaired reproduction. Fish will avoid waters with low O2 if possible, but bottom-dwelling organisms are limited in the degree to which they can avoid low oxygen water. Negative biological impacts are seen at concentrations that lie below 4 to 5 mg/L. Effects are severe at levels below 2 mg/L O2, which is termed hypoxia. Anoxic conditions are said to be present when O2 is undetectable. The following link provides more information on the thresholds at which marine organisms experience negative effects of low oxygen: http://www.pnas.org/content/105/40/15452.full.pdf.
Regions that regularly experience hypoxia are termed “Dead Zones”. The number of reported dead zones has approximately doubed every decade since the 1960s. This trend is largely attributed to an increased rate of nitrogen being introduced into the marine environment as a result of human activities. For example, nitrogen-based fertilizers that are not consumed by terrestrial plants can be transported into coastal waters by river and stormwater runoff, submarine ground discharge, and atmospheric processes.
Nutrients discharged into coastal waters stimulate the growth of single-celled algae called phytoplankton. This newly created organic matter eventually ends up as a food source for natural bacteria. These bacteria consume organic matter via a metabolism call aerobic respiration in which they also consume O2, leading to lowered levels in the water. Nutrient loading can also alter algal community structures, favoring the growth of harmful species that are toxic to humans and marine life. Nutrient loading is not the only mechanism by which algae growth can be stimulated. Over growth can also result from removal of consumers, such as from over harvesting of filter-feeding oysters and small fish.
Another concern arises from the physical behavior of O2 gas. Namely, it becomes less soluble with increasing temperature. Thus a continued rise in ocean temperatures is expected to lead to a further increase in the number and intensity of dead zones.
Dead zones are typically found downstream of large rivers, such as the Mississippi, where a steady load of nitrogen is being discharged into the Gulf of Mexico, largely as a byproduct of the farming of crops and livestock. Other long-standing dead zones occur in the Chesapeake Bay and Long Island Sound where numerous rivers supply large loads of nutrients and water circulation is restricted by the shape of the shoreline. In these settings, farming is only one of many land-based activities that supply nutrients to the coastal waters. Others include discharge of treated effluent from sewage treatment plants, landscape fertilizing, and runoff from developed lands. Burning of fossil fuels releases a gas that eventually deposits nitrogen onto the sea surface.
In response to this world-wide trend, many countries and the United Nations Environmental Programme have instituted campaigns to reduce nitrogen loading. See http://initrogen.org/ for more information.
Low Oxygen in Long Bay
In July 2004 local fishermen reported a “jubilee” during which numerous large flounder were caught all along the Grand Strand. The fishermen also reported that their bait fish, suspended in buckets at mid depths, were dying. Coastal Carolina University faculty and students determined that O2 levels in the bottom water were very low (less than 2 mg/L), and were likely causing the flounder to move into the surface waters and surf zone in search of higher O2 levels.
Scientists were initially puzzled by the occurrence of such low O2 levels as this phenomenon is not known to occur in shallow waters off sandy beaches distant from large rivers. The SC Department of Natural Resources (SC DNR) installed water quality sensors at the seawater end of Apache Pier in June 2006 to learn more about the frequency and causes of the low O2 events. Other contributors to this monitoring effort have included: Apache Pier and Family Campground, SC DHEC Office of Ocean and Coastal Resource Management, SC Sea Grant Consortium, Coastal Carolina University, and the SC Chapter of the Coastal Conservation Association.
In 2011, the municipalities of the Grand Strand expanded monitoring to the Second Avenue Pier in Myrtle Beach and the Cherry Grove Pier in North Myrtle Beach. All three piers have sensors located 1 m below the sea surface and 1 m above the sea floor to measure temperature, salinity and O2 levels every 15 minutes. At two piers, additional sensors monitor turbidity, pH, and chlorophyll levels. A meteorology station mounted 15 feet above the pier deck collects wind, barometric pressure, temperature, and precipitation data. The results are relayed to this public website in near real time. An explanation of what each parameters means is provided in the next section.
This monitoring equipment serves several purposes. First, it serves as an early warning device to alert the proper authorities of ongoing low O2 events. Second, the monitoring stations serve the fishing public by supplying real-time water conditions continuously throughout the year, thereby allowing them to predict the movements of different fish species. Third, the data are used by researchers in the Long Bay Working Group whose goals are to determine the causes and effects of low O2 in Long Bay, as well as how we can reduce its occurrence.
Data collected thus far have shown that low O2 events occur from May through October, and typically last from a few hours to several days. The low O2 conditions occur in water depths of 5 to 10 m and tend to be present in a region extending from northern Myrtle Beach to Surfside. The lowest O2 levels follow a few days of southwesterly winds once winds speeds fall below 10 mph. These episodes end when wind speeds increase, causing O2 levels to rise.
Fishermen at the piers report declining catches during the periods of low O2, along with kills of their bait fish. The most intense, longest period of low O2 was observed in August and September of 2009, during which levels fell to 0 mg/L. This condition is termed “anoxia”. During August 2009, anoxic conditions were observed in the surface and bottom waters for a period of a few days, with hypoxic conditions (< 2 mg/L) enduring for over a week.
Based on monitoring conducted since 2006 and various companion research efforts, the Long Bay Working Group have developed the following working hypothesis to explain why Long Bay is experiencing periods of hypoxia and anoxia. During the summer, southwesterly winds combined with solar heating to create oceanographic conditions that limit mixing of the nearshore waters, keeping them close to shore. This constrained mixing is most pronounced where Long Bay is most convex. This is the location of the Grand Strand. The relative calmness of the waters in this region is a major reason why we have wide sandy beaches. The mixing rate of the coastal waters is now being measured through continuous radon measurements. Radon is a naturally occurring radioactive gas that is discharged into Long Bay as part of groundwater seepage so these monitoring data also provide information on the submarine ground discharge into Long Bay. These data are not available online.
When mixing with offshore waters is sluggish, nutrients and organic matter are confined to a nearshore region where they stimulate aerobic respiration and hence the removal of O2 by marine bacteria. The exact sources of the nutrients and organic matter and mechanisms by which they stimulated microbial uptake of O2 are a matter of active research. An important finding is a nearly continuous enrichment of phytoplankton and particulate matter in the bottom waters. Tides and longshore currents are thought to play an important role in the development of hypoxia, as they resuspend particles from the seafloor, churning them into the overlying waters where they are more readily available for microbial attack.
The source of the organic matter and nutrients fueling the development of low O2 in Long Bay is the focus of much active research. Some sources currently being investigated are submarine ground discharge through the beach face and export from tidal swashes. Some evidence suggests that the biomass of phytoplankton is insufficient to provide enough organic matter to support the observed O2 deficit. This is contrary to what occurs in other dead zones, where algal overgrowth is well documented, and suggests a unique aspect to the underlying causes of hypoxia in Long Bay.
A preliminary assessment of the impact of low O2 on the marine life of Long Bay is being conducted by monitoring larval recruitment onto ceramic plates suspended from the piers. Since no similar data have been collected, a baseline will have to be established to compare larval recruitment success under periods of oxic versus hypoxic conditions.
To read more and see some pictures, visit http://www.coastal.edu/eql/projects/hypoxia.html .
What do the Data Mean?
Dissolved Oxygen: The concentration of oxygen gas dissolved in water is reported in units of mg of O2 per liter of seawater. Fish are affected at concentrations below 4 to 5 mg/L.
Percent saturation of oxygen: Waters in contact with the atmosphere can exchange O2 gas since air is 21% O2 by volume. If gas exchange with the atmosphere is the only source of O2 gas, water will acquire a concentration from simple dissolution that can be predicted from its temperature. Seawater of salinity 35 will dissolve 6.6 mg/L of O2 at 77 oF when in gaseous equilibrium with the atmosphere at a barometric pressure of 30 in Hg. At 50 oF and the same salinity and barometric pressure, this water will dissolve 8.8 mg/L of O2.
If the observed O2 concentration is greater than predicted from the temperature, the water is said to be supersaturated with respect to oxygen. This usually results from production of O2 by phytoplankton and bubble injection from waves. If the observed O2 concentration is less than predicted from the temperature, the water is said to be undersaturated with respect to O2. This usually results from consumption of O2 by marine bacteria, with minor amounts removed by animals.
To track the degree of saturation, a percentage is calculated that represents the ratio of the observed O2 concentration to the level predicted from the water temperature and a “normal” barometric pressure of 1 atm (30 in Hg). A percentage greater than 100% is supersaturated and a percentage less than 100% is undersaturated. During the summer, undersaturations below 60% occur when O2 concentrations fall below 4 mg/L.
Salinity and barometric pressure influence oxygen solubility, but these effects are small compared to the influence of temperature. The water quality sensors report percent saturation of oxygen based on the temperature, salinity, and O2 concentration of the water.
Temperature: Water temperature is reported in oF. This information is used to track water mass movements and to compute the percent saturation of O2 as described above.
Salinity: This is a measure of the salt content of seawater. In the world ocean, salinity ranges from 34 to 37. This measurement is unitless by international convention, but can be thought of as the grams of salt dissolved in a 1000 grams of seawater, which is equivalent to a concentration unit of a part per thousand (ppt). Salinities less than 34 can follow significant rain events as rain water will dilute the salt level of seawater. Higher salinity reflects the intrusion of Gulf Stream waters into the nearshore. Thus salinity, along with temperature, is used to track water mass movements. It is also used to compute the percent saturation of O2.
pH: This is a measure of the acidity of the water and is unitless since it represents the negative logarithm of the hydrogen ion concentration. Seawater tends to have an alkaline pH of around 8.1. The pH of seawater is quite stable because of the presence of high concentrations of bicarbonate that buffers against addition of acids. pH’s below 8.0 suggest the impact of significant amounts of acidifying materials, such as CO2. This gas is a byproduct of aerobic respiration. Low pH’s can also be the result of freshwater input following rain events as this dilutes the salt level of the nearshore waters, including the bicarbonate concentration.
Chlorophyll: This is an estimate of the green pigment contained by living phytoplankton that are single-celled algae. The pigment concentrations are reported in units of micrograms chlorophyll per liter of seawater (ug/L). This provides an indirect measure of the abundance of the phyoplankton since chlorophyll concentrations increase with increased abundance of algal cells. The chlorophyll sensors are calibrated after the data are collected, so the concentrations reported at the online site have not been corrected for calibration shifts. If you need the corrected data, please contact us.
Turbidity: This is a measure of the concentration of particles in the water that reflect light as detected by a turbidity sensor. The observations are reported in nephelometric turbidity units (NTU). The SC Department of Health and Environmental Control has established a water quality standard of 25 NTU for coastal waters. High loads of particles can produce environmental problems such as: (1) clogging filter-feeding organs of marine organisms, (2) burial of bottom-dwelling organism once the particles settle to the seafloor, (3) transport of oxygen demand into the water body if the particles are organic in nature, and (4) transport of pollutants, such as PAHs and fecal indicator bacteria, which tend to adhere to particles.
Weather conditions: The weather stations are located 15 feet above the pier decks. Every 5 minutes, these sensors report instantaneous air temperature in oF, barometric pressure in inches of Hg, relative humidity in percent, wind direction in degrees, and wind speed in miles per hour. Rainfall is measured as inches accumulated over a 5-minute observation interval.
Current Data
Real-time data being collected from the piers are available at the following locations:
- Hydromet Cloud. Click the dots on the map to get current readings. For more options, click on the 3 horizontal lines in the upper lefthand corner and select "Custom Reports"
- Long Bay Observing System, This provides the past 24 hours of data at each of the piers..
- Cherry Grove pier display. This displays the current data in a dial format as used on a large-screen display at the Cherry Grove Pier.
- 2nd Avenue pier display. This displays the current data in a dial format as used on a large-screen display at the 2nd Ave Pier.
- Apache pier display. This displays the current data in a dial format as used on a large-screen display at the Apache Pier.
Historical Data
- For data after July 2015, visit the Hydromet Cloud site.
-
For data prior to July 2015, .csv files (in LST) are provided for Apache Pier (begining June 2006), 2nd Ave Pier (begining May 2012) and Cherry Grove Pier (begining May 2012) at the following links:
- Apache Pier
- 2nd Ave Pier
- Cherry Grove Pier
- Data from Springmaid Pier (2006 to 2007) are availabe at: http://nautilus.baruch.sc.edu/CSV/Springmaid_DO/ .
Related Real-time Data
Currents
Meteorology and Tides
Publications and Presentations
Bevington, A., S. Libes, J. Bennett, A. Hall, N. Capper and E. Tosso (2004) Hypoxia in the Surf Zone of the Grand Strand: Likely Causes. Southeastern Estuarine Research Society. Semiannual Meeting, Oct 14-16, 2004, Wilmington, NC. (best undergraduate oral presentation) and SC Section of the American Water Works Association and SC Water Environment Association´s 15th Annual South Carolina Environmental Conference, Mar 19-23, 2005, Myrtle Beach, SC. (poster)
Gutierrez, B.T., G. Voulgaris, and P.A. Work, 2006. Cross-shore variation of wind-driven flows on the inner shelf in Long Bay, South Carolina, United States. Journal of Geophysical Research 111:1-16.
Koepfler, E.T. 2010. Surface water and depth profile spatial patterns of hypoxia development along the Grand Strand, South Carolina. Proceedings of the 2010 South Carolina Water Resources Conference, held October 13-14, 2010, at the Columbia Metropolitan Convention Center.
Libes, S., and S. Kindelberger. 2010. Hypoxia in the Nearshore Coastal Waters of South Carolina along the Grand Strand. South Carolina Water Resources Conference. October 13-14, 2010. Columbia, SC.
Libes, S., M. Trapp, S. Kindelberger and D. Doremus. 2014. Long Bay Hypoxia Monitoring Consortium. Journal of South Carolina Water Resources, Vol.1, p.26-31.
McCoy, C., R. Viso, R.N. Peterson, S. Libes, B. Lewis, J. Ledoux, et al. 2011. Radon as an Indicator of Limited Cross-Shelf Mixing of Submarine Groundwater Discharge along an Open Ocean Beach in the South Atlantic Bight During Observed Hypoxia. Continental Shelf Research DOI 10.1016/j.csr.2011.05.009.
Peterson, R.N., W.S. Moore, S.L. Chappel, R.F. Viso, S.M. Libes, and L.E. Peterson. 2016. A new perspective on coastal hypoxia: The role of saline groundwater. Marine Chemistry. 179:1-11. doi:10.1016/j.marchem.2015.12.005.
Sanger, D., D. Hernandez, S. Libes, G. Voulgaris, B. Van Dolah, G. Reikerk, B. Davis, E. Smith, R. Shuford, D. Porter, E. Koepfler, and J. Bennett (2010) A Case History of the Science and management Collaboration in Understanding Hypoxia Events in Long Bay, South Carolina, USA. Environmental Management, 46: 340-350.
Sanger, D.M., E.M. Smith, G. Voulgaris, E.T. Koepfler, S. Libes, G.H.M. Riekerk, et al. 2012. Constrained Enrichment Contributes to Hypoxia Formation in Long Bay, South Carolina (USA), an Open Water Urbanized Coastline. Marine Ecology Progress Series. 461:15-30.
Smith, E.M. Smith, T. Buck and B. Lakish. 2010. Biological Regulation of the Formation of Hypoxia. Proceedings of the 2010 South Carolina Water Resources Conference, held October 13-14, 2010, at the Columbia Metropolitan Convention Center.
Troup, M.L., D.B. Fribance, S. Libes, R. Gurka and E.E. Hackett. 2017. Physical conditions of coastal hypoxia in Long Bay, South Carolina: 2006-2014, Estuaries and Coasts. DOI 10.1007/s12237-017-0246-x
Voulgaris, G., and R. Sanay. 2010. Physical Oceanographic Constraints Contributing to the Development of Low Oxygen Events in Long Bay, SC. South Carolina Water Resources Conference. October 13-14, 2010, Columbia, SC.
Reports
-
Reports summarizing findings can be downloaded from the following links: SC DHEC OCRM report 2008 and SC DNR report 2009.
Contact Us
Dr. Susan Libes
Burroughs & Chapin Center for Marine and Wetland Studies
Coastal Carolina University
290 Allied Drive
Conway, SC 29526
(843) 349-4028
susan@coastal.edu
return to menu
![]()
Research Division
Principal Investigator(s)
Related Content
Student Involvement
Read what students say about their experience working on this project.